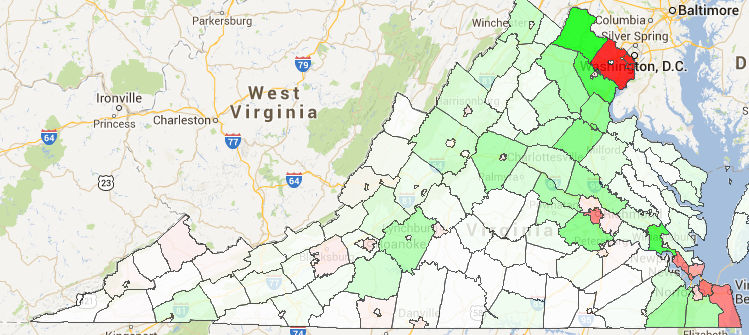
In the above map, from howmoneywalks.com, Fairfax County is bright red because since 1993 taxpayers with Average Gross Income (AGI) totaling over $6 billion have left Fairfax County. Most have moved to neighboring Loudoun and Prince William counties, which are bright green. Counties in green have had a net gain of taxpayers. Meanwhile, between 2000 and 2011 the number of Fairfax County residents living in poverty increased 70 percent, from 43,396 to 73,794 (U.S. Census Bureau, 2000 Decennial Census and 2011 American Community Survey).
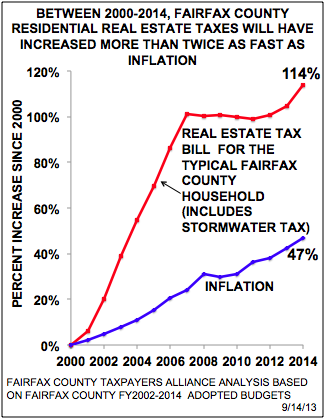
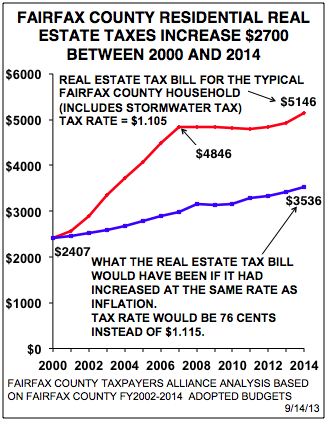
The Fairfax County Board of Supervisors increased real estate taxes 100% (from $2400 to $4800) between 2000 and 2007. Last year the supervisors increased real estate taxes by 1.9 percent ($93 for the typical homeowner). This year the supervisors increased taxes another 4.4 percent ($219). Compared to 2000, this is a cumulative increase of 114 percent and gives the supervisors an extra $1,190 million (nearly $1.2 billion) in revenues. Most of the extra $1.2 billion is not spent to improve county services but to subsidize the soaring cost of school and county pensions, zero-deductible medical insurance, and raises.
Each year, hundreds of advocates for higher taxes testify at the Board of Supervisors budget hearings, generally held in late March or early April. Speakers for higher taxes greatly outnumber advocates for lower taxes.
The Taxpayer Alliance every year sponsors a rally on the first night of the budget hearings, at 6. p.m. in front of the Government Center. Attend next year's rally, which will be announced on this site. Also, write (do not call or email) your supervisor to ask for lower taxes. Go to "Identify your elected representatives" section above to identify your supervisor.
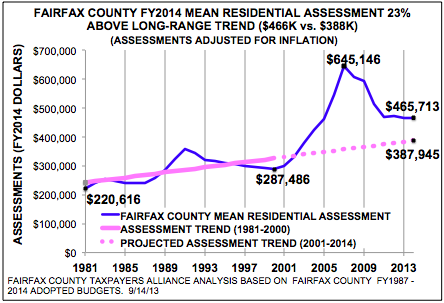
The term "Great Recession" suggests that there is less wealth now than before the housing bubble (2000-2007) began. However, the FY2014 Fairfax County median residential assessment is $465,713, which is 62 percent higher than the inflation-adjusted mean residential assessment in 2000 ($287,486) and 20 percent higher than what the mean inflation-adjusted assessment would have been today ($387,945) if assessments had increased at the same rate as they did in the two decades before 2000.
(Half of Fairfax County annual tax revenues are transferred to the Fairfax County Public Schools.)
         RANKING OF FAIRFAX COUNTY PUBLIC HIGH SCHOOLS
        BASED ON 2010 ACT COLLEGE ENTRANCE TEST RESULTS
   RANK      SCHOOL            Total Tested   Avg Score   % College Ready
  1   THOMAS JEFFERSON            107           33             98%
  2   MCLEAN HIGH                 170           26             62%
  3   LANGLEY HIGH                201           26             57%
  4   OAKTON HIGH                 255           26             57%
  5   WOODSON HIGH                195           26             57%
  6   W SPRINGFIELD HIGH          135           25             55%
  7   MADISON HIGH                155           25             53%
  8   FALLS CHURCH HIGH            51           23             45%
  9   ROBINSON SEC.               245           24             44%
      FCPS                       3511           24             44%
 10   MARSHALL HIGH                87           25             43%
 11   LAKE BRADDOCK SEC.          143           25             43%
 12   CHANTILLY HIGH              283           24             43%
 13   WESTFIELD HIGH              164           24             41%
 14   SOUTH LAKES HIGH             80           23             39%
 15   WEST POTOMAC HIGH           137           23             39%
 16   HERNDON HIGH                157           23             37%
 17   CENTREVILLE HIGH            147           23             34%
 18   FAIRFAX HIGH                116           23             34%
 19   EDISON HIGH                 133           22             34%
 20   SOUTH COUNTY SEC.           125           23             33%
      VIRGINIA                  19236           22             31%
 21   ANNANDALE HIGH              110           22             26%
      NATION                  1568835           21             24%
 22   HAYFIELD SEC.                88           21             22%
 23   LEE HIGH                     54           21             20%
 24   STUART HIGH                  85           21             18%
 25   MOUNT VERNON HIGH            81           20             14%
Repeal the Transportation Tax Hike
This handout was distributed at the Virginia Republican Party State Convention, May 17-18, 2013.
(Additional PDF files not yet uploaded to this site.)
Fred Costello Report 093 - Is an Increase in the Real Estate Tax Rate Affordable?
FCTA 2013 Fall Bulletin - Repeal the transportation tax hike
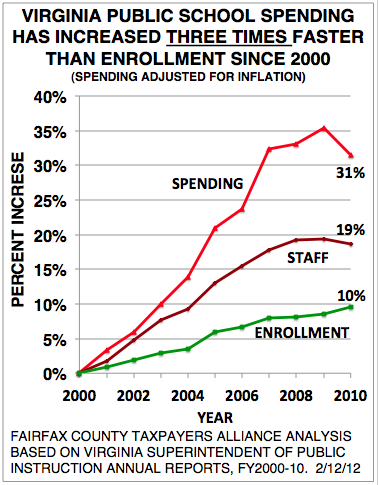
FCTA 2013 Spring Bulletin - 2000-2007 tax increases spent on county salaries
FCTA 2013 Winter Bulletin - Sharon Bulova misleads taxpayers?
FCTA 2012 Fall Bulletin - America's path to bankruptcy
Virginia has plenty of money for transportation, without additional tax hikes.
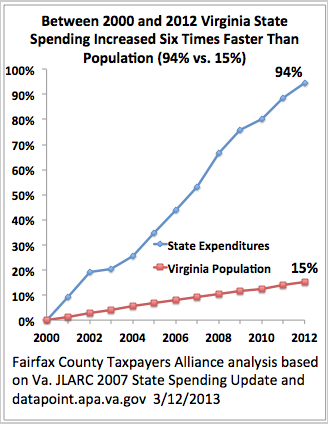
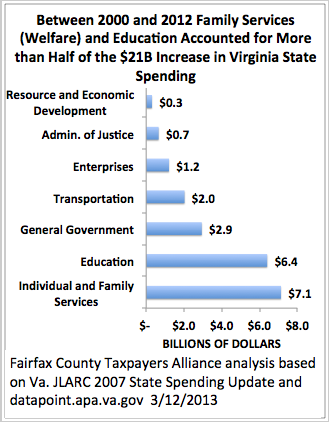
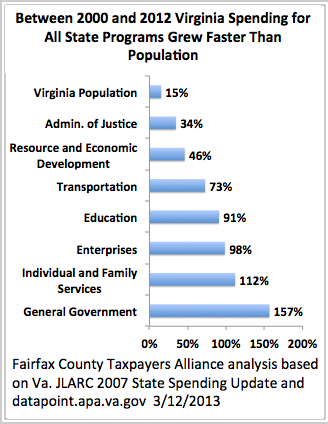
Between FY2000 and FY2012, the Virginia budget (General Fund + Non-General Fund) increased by $21 billion, from $22 billion to $42.7 billion, a 94 percent increase. Over the same period Virginia population increased by only 15 percent, from 7.1 million to 8.2 million.
Of the $21-billion increase:
These three items account for $15 billion of the $21 billion increase. The numbers above come from the Joint Legislative Audit and Review Commission (JLARC) Review of State Spending: 2007 Update, Review of State Spending: 2012 Update (see especially page 39 of the latter), and the Commonwealth Datapoint website. (There is a small inconsistency between JLARC and Commonwealth Datapoint numbers.) Spending is not adjusted for inflation, which is appropriate because private-sector wages are not keeping up with inflation.
How carefully have the General Assembly and the Governor managed these disproportionate increases in education and Medicaid spending?
According to the ACT college admissions test 2012 Profile Report for Virginia, of the 21,647 Virginia students tested, only 33 percent were prepared for college (p. 7). Of that sample, while 40 percent of white students were prepared for college, only 7 percent of African-American students were prepared, showing the state's neglect of minority student achievement (p. 22).
Despite being the largest and fastest-growing item in the Virginia budget, Medicaid is broken. The waiting list for Medicaid waivers, so disadvantaged persons can be cared for at home instead of institutions, has over 7000 names. For those lucky enough to get a waiver, the reimbursement rates are too low to retain caregivers. Reimbursement rates for doctors are low, making it difficult to find doctors accepting Medicaid. Fraud is a problem. Medicaid promotes dependency instead of self-sufficiency, and where charity is needed private charity is more efficient than charities run by politicians.
New taxes reward and subsidize the General Assembly's and Governor's failure to rein in out-of-control spending on education and Medicaid, programs that are not meeting their goals. Rather than raise taxes, elected officials should better manage the revenue they have.
Arthur Purves
President
Fairfax County Taxpayers Alliance
purves@fcta.org
02/21/2013
 |
Obama's Path to Bankruptcy: This is the Obama administration's projection of the federal debt. It assumes "tax hikes for the rich", predicted savings from "Obamacare," and the end of the war in Afghanistan. Yet, the Treasury Department's Citizen's Guide to the 2011 Financial Report of the U.S. Government states (p. xii) states, "The continuous rise of the debt-to-GDP ratio illustrates that current policy is unsustainable" (emphasis added). |
 |
Evolution of the Nanny State: In 1960 defense was 55 percent of federal outlays and entitlements were 26 percent . By 2011 defense was 20 percent of outlays and entitlements, including education, were 64 percent. |
 |
The President's FY2013 budget projected $3.8 trillion in outlays and $2.9 trillion in revenues, leaving nearly a $1 trillion deficit. To eliminate the deficit without eliminating defense requires significant cuts to entitlements. |
 |
As a condition to raising the debt limit last year, Tea Party congressmen required cutting the annual federal budget (about $4 trillion) by $100 billion. This is only a three percent cut. However, the resulting agreement, called the Budget Control Act of 2011, or "sequestration", imposes a disproportionate share of cuts on defense while sparing entitlements. |
